
Fast-moving hiring teams close offers in under two weeks and see acceptance rates of 80 to 90 percent or higher, while slower or constrained processes often land below 60 percent. The single fastest lever to move that number is cutting the time between final interview and signed offer, paired with a sourcing mix that leans more heavily on referrals than on inbound or outbound sourcing. If we track only one pair of metrics this quarter, it should be offer acceptance rate and time-to-offer for our priority roles.
TL;DR:
Early career programs average about 49% acceptance, while students decide in 9 days and employers take 27.3 days from first interview to offer.
Segment acceptance results by role tier and candidate source; any segment below 60% should prompt an audit of offer timing before compensation changes.
Calculate acceptance using signed offer letters, monitor it with a rolling 90 day window, report quarterly by segment, and track later withdrawals separately.
Referral source targets are higher than other channels: aim for 80% to 90% acceptance, and investigate any referral segment below 70%.
For priority roles, test extending offers within 72 hours of the final interview, then compare acceptance with the role’s previous quarter.
Benchmarks by role level and candidate source
Acceptance rates are not one number. They shift by seniority, by how a candidate entered the pipeline, and by how long the process takes to reach a signed offer. Treating a single blended percentage as a performance target hides where a program is actually underperforming.
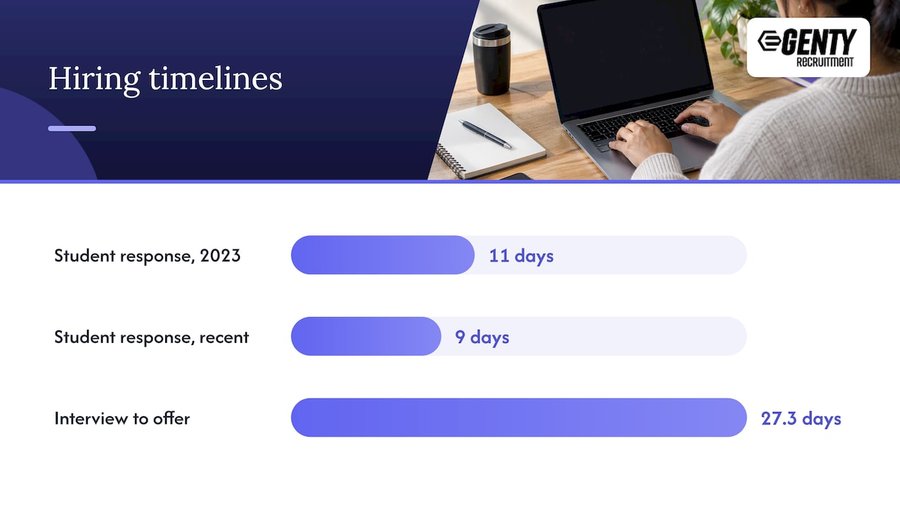
At the entry-level and campus tier, the clearest benchmark comes from the NACE 2025 Recruiting Benchmarks Report, which puts early-career offer acceptance near 49 percent. That same data shows students responding to offers in an average of 9 days, down from 11 days in 2023, even as employers’ lag time from first interview to offer averaged nearly four weeks. The mismatch is the story: candidates are deciding faster while employers are moving slower, which is a losing combination for acceptance rates.
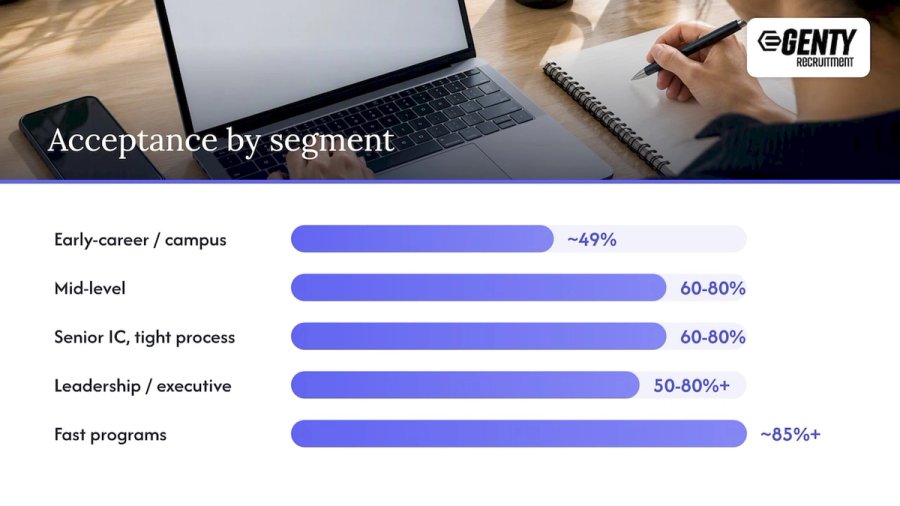
Mid-level engineering and sales roles typically land in a wider band, generally 60 to 80 percent, depending heavily on process speed and competing offers in the market. Senior engineering roles tend to track similarly when the process is tight, but acceptance drops quickly once a search drags past four weeks, since senior candidates usually have multiple active conversations. Leadership and executive searches carry the widest variance of any tier: a well-run executive search with strong alignment on compensation and scope can clear 80 percent, while a search with vague scoping or compensation surprises can fall well under 50 percent.
Before you start hiring
Check location, salary, and hiring fit
If you are moving from research to action, start with the market basics so your hiring plan is clearer.
Source mix changes the picture as much as seniority does. According to Ashby’s 2026 Recruiting Operations Benchmarks, referred candidates consistently outperform both inbound applicants and outbound-sourced candidates on offer acceptance, across both technical and business roles. The pattern holds for a simple reason: a referral arrives with social proof and realistic expectations about the role, while a sourced candidate often needs more convincing throughout the process and is more likely to be weighing a competing offer at the finish line.
A few patterns are worth pulling out of that table and watching on a recurring basis:
- Early-career programs should benchmark against the 49 percent NACE figure, not against mid-level numbers, since the candidate behavior is structurally different.
- Any role sitting below 60 percent acceptance deserves a time-to-offer audit before a compensation review.
- Referral share of pipeline is a leading indicator worth tracking alongside acceptance rate itself, not after the fact.
- Executive searches need their own benchmark band because scope and compensation negotiation add variance that lower-level roles rarely see.
The practical takeaway for a recruiting leader building a scorecard: segment every acceptance rate by role tier and source before comparing it to any external benchmark. A blended 65 percent acceptance rate could mean a healthy mid-level program dragging down a strong referral channel, or it could mean every segment is mediocre. Only the breakdown tells you which.
How to calculate and segment your acceptance rate
The formula itself is simple: accepted offers divided by offers extended within the same window. The complexity lives in the definitions underneath it, and getting those definitions wrong is the most common reason two teams report different numbers for what looks like the same metric.
Start by defining “accepted.” A verbal yes from a candidate is not the same event as a signed offer letter, and a signed offer letter is not the same event as a candidate who actually starts. Reneges, where a candidate accepts and then backs out before or shortly after the start date, need their own tracking line rather than being folded into either the acceptance or rejection count. Mixing these together makes the metric unreliable for comparing periods or teams.
Recommended measurement windows:
- Run a 90-day rolling window for operational monitoring, so a single bad month on one role does not distort the trend.
- Run a quarterly snapshot for reporting to leadership, segmented by role tier and source.
- Flag reneges separately and report a renege rate alongside acceptance rate rather than netting them out silently.
Segmentation matters as much as the formula. The same acceptance rate calculated at the company level can mask serious variance:
- Segment by role (engineering, sales, operations, leadership) since candidate expectations and competing offers differ sharply across functions.
- Segment by source (referral, inbound, sourced/outbound) to see which channels are actually converting.
- Segment by seniority within each role, since junior and senior candidates respond to speed and compensation signals differently.
Metrics to monitor alongside acceptance rate:
- Time-to-offer, measured from final interview to offer extended, since this is the strongest lever available to most teams.
- Offer rate, the share of final-round candidates who receive an offer, which indicates pipeline quality upstream of acceptance.
- Renege rate, tracked separately from declines, since a renege often signals a counteroffer or a slow-moving competing process.
- Candidate response time, which tells us how urgently candidates are deciding and whether our own internal timeline matches their pace.
A dashboard built on these four metrics, segmented the way described above, gives a far more useful picture than a single blended acceptance percentage. It also makes it possible to diagnose a problem precisely: a low acceptance rate paired with a high renege rate points to compensation or counteroffer issues, while a low acceptance rate paired with slow time-to-offer points squarely at process speed.
What actually moves acceptance rates up
Two levers show up repeatedly in industry guidance as the highest-impact changes a recruiting team can make, and neither one requires raising base compensation.
Speed is the first. Indeed’s hiring guidance ties faster offer cycles directly to materially higher acceptance, with programs that close within 14 days, and ideally within 72 hours of the final interview, seeing meaningfully stronger outcomes than programs stretching to three or four weeks. Transparency on compensation bands is the second: candidates who know the range going into final rounds are less likely to walk away from an offer that lands within expectations, because there is no late-stage surprise to react against.
Source strategy compounds both effects. Referred candidates convert at higher rates in part because they already understand the role, the team, and the likely compensation before they ever enter a formal process. Building a stronger referral program, and nurturing inbound applicants with consistent communication rather than letting them go quiet between stages, raises baseline acceptance before a single interview happens. Campus and early-career channels behave differently again: the NACE data shows students deciding in 9 days on average while employers take 27.3 days to extend an offer after the first interview, so campus programs need their own internal speed targets rather than borrowing targets built for experienced-hire pipelines.
Offer framing and follow-up matter more than most teams assume. A structured acceptance sequence, where the hiring manager and recruiter both reach out within a defined window after the offer goes out, keeps momentum going during the period when a candidate might otherwise be fielding a counteroffer. A clear counteroffer playbook, prepared before an offer is extended rather than improvised after a candidate hesitates, prevents a strong candidate from drifting away during the days when a current employer makes a late push to retain them.
Three experiments worth running this quarter:
- Reduce time-to-offer to under 72 hours for at least one priority role and track the acceptance rate change over the following quarter.
- Add compensation bands to the offer conversation at the final interview stage instead of waiting until the formal offer.
- Add one additional recruiter or hiring manager touchpoint in the 48 hours after an offer goes out, before the candidate’s decision deadline.
Pro Tip: Treat time-to-offer as a team-wide service level agreement, not a recruiter metric. Hiring managers who delay feedback are usually the real bottleneck behind a slow offer cycle.
The LATAM angle: how nearshore hiring changes the benchmarks
Sourcing from Latin America changes more than cost. It changes the mechanics behind time-to-offer and acceptance rate, which is where the real benchmark impact shows up.
Salary differentials are the most visible factor. A mid-level software engineer in Argentina, Brazil, Mexico, or Colombia typically commands a fraction of equivalent US compensation, which lets companies extend offers that are highly competitive within the candidate’s local market while still representing meaningful savings on the hiring side. We work with clients who save up to 40 percent compared to hiring the same role in the US or Europe, savings that come from local cost-of-living differences rather than from underpaying candidates relative to their own market. That gap matters for acceptance rates directly: a candidate who sees an offer land well within or above their local market range decides faster and reneges less often.
Timezone overlap removes a friction point most hiring teams underestimate. Candidates across Argentina, Brazil, Mexico, and Colombia typically work hours that overlap substantially with US EST and PST, which means interview scheduling does not stretch across multiple days of back-and-forth and offer calls do not wait for an awkward time slot. That overlap alone can take days off a process that would otherwise stall on scheduling friction with candidates in Europe or Asia.
Shortlist quality is where process speed and acceptance rate connect most directly. Our skill-first recruitment approach delivers curated shortlists within 7 days, which means hiring managers are reviewing pre-vetted candidates almost immediately instead of waiting weeks for a pipeline to fill. A faster shortlist shortens the entire funnel: less time between first contact and final interview means less time for a candidate to pick up a competing offer, and that compresses the exact variable, time-to-offer, that drives acceptance rates most reliably.
What this means operationally for a hiring leader comparing the two paths:
- In-house pipelines for LATAM roles often require building new sourcing channels and local market knowledge from scratch.
- A managed, curated shortlist removes the sourcing ramp-up and puts vetted candidates in front of hiring managers within a week.
- Fixed-fee pricing per seniority level removes the budgeting uncertainty that can come with contingency recruiting fees tied to final salary.
- A replacement guarantee reduces the downside risk of a mis-hire without restarting the entire search from zero.
Setting targets: good, warning, and stretch bands
Benchmarks are only useful once they turn into targets a team can act on. The goal is not to chase a single industry number but to set bands by role tier and source, then triage anything that falls into the warning zone before it becomes a pattern.
When a role or source falls into the warning band, the triage sequence should be consistent rather than reactive:
- Audit time-to-offer first, since a slow process is the most common root cause across every tier.
- Review compensation positioning against current market data before assuming the offer itself is the problem.
- Test referral activation for that specific role, since a weak source mix often explains a weak acceptance rate better than compensation does.
- Check for a renege pattern specifically, which points to counteroffers rather than a flawed initial offer.
Turning targets into OKRs: a useful structure is a 30/60/90-day cadence. In the first 30 days, baseline current acceptance rate and time-to-offer by segment. In the next 30, run one or two of the experiments described earlier, such as cutting time-to-offer or adding comp transparency. In the final 30, compare the segment’s new numbers against the bands above and decide whether to formalize the change as a standard process or keep testing.
Acceptance rates vary sharply across tech sectors
A blended “tech industry” benchmark hides real differences between sectors, because compensation expectations, competing offer density, and candidate urgency differ by market segment.
FinTech roles, particularly compliance-adjacent and backend engineering positions, often see acceptance rates pulled down by longer background check and regulatory onboarding timelines that extend the gap between final interview and start date, even when the offer itself moves quickly. AI-focused roles, especially machine learning engineering, currently sit in one of the most competitive hiring markets in tech, which means candidates frequently hold multiple simultaneous offers and acceptance rates swing heavily on speed and equity packaging rather than base salary alone.
SaaS companies, by contrast, tend to run more standardized, faster hiring processes, which generally supports stronger acceptance rates when time-to-offer stays tight. Web3 and crypto-adjacent roles carry the widest swings of any segment: strong market periods pull in high candidate interest and reasonable acceptance, while downturns in that sector can suppress acceptance significantly as candidates grow cautious about token-based compensation or company stability.
For a recruiting leader benchmarking across a multi-product tech company, the practical move is to compare acceptance rates within sector rather than against a single company-wide average, since a strong SaaS division and a struggling Web3 division will cancel each other out in a blended number and hide where the real problem sits.
How acceptance rates have shifted over recent hiring cycles
Offer acceptance behavior has moved with the broader labor market rather than staying fixed. During tighter labor markets with high candidate demand, acceptance rates for in-demand technical roles tend to compress as candidates juggle multiple live offers and negotiate longer before committing.
The NACE data illustrates one clear trend line within early-career hiring: student response time to offers dropped from 11 days to 9 days across recent cycles, even as employer lag time between first interview and offer stayed elevated at 27.3 days. That gap is a trend worth watching year over year: as candidate decision speed keeps compressing, any employer that does not also speed up its own offer process will see acceptance rates erode relative to competitors who do.
For recruiting leaders building multi-year benchmarks, the useful practice is tracking time-to-offer and acceptance rate together on a rolling basis rather than comparing single-quarter snapshots. A quarter with an unusually fast or slow process for one or two senior roles can swing a small company’s blended number without reflecting any real shift in the broader market. Tracking the trend over several quarters, segmented by role and source, separates real market movement from noise in a small sample.
Does how you deliver an offer change whether candidates accept it?
The format of the offer conversation itself, verbal, written, or through a digital offer platform, shapes acceptance rates in ways that are easy to overlook next to compensation and speed.
A verbal offer delivered live by the hiring manager or recruiter, followed promptly by written confirmation, tends to perform best because it combines personal connection with the urgency of a direct conversation. A candidate hearing enthusiasm directly from a future manager responds differently than one who receives a cold email with an attached PDF. Purely written offers, especially ones sent without a prior verbal heads-up, risk feeling transactional and give a candidate more room to sit with doubts in isolation rather than ask clarifying questions in real time.
Digital offer platforms, where a candidate reviews and signs an offer letter online, add convenience and often speed up the formal signing step, but they work best as a follow-up to a verbal conversation rather than as a replacement for one. The combination that tends to perform strongest is a verbal offer call, same-day written confirmation with full compensation details, and a digital signing step that removes friction from the final yes. Skipping the verbal step and going straight to a digital document is one of the more common process gaps behind an otherwise strong candidate going quiet after an offer goes out.
A note on reading these benchmarks correctly
Benchmarks are a starting point, not a verdict. I have spent my career in recruitment operations watching teams either over-correct on a single disappointing quarter or ignore a real pattern because the blended company number looked fine.
The judgment call is knowing when to hold a conservative target and when to push for an aggressive one. A seed-stage startup hiring its first ten engineers should expect more variance and set a slightly lower bar than a Series C company with a mature brand and referral engine. Geography matters too: a LATAM-sourced pipeline with a tight 7-day shortlist and strong timezone overlap can realistically target the higher end of the mid-level band, because so much of the friction that slows down acceptance elsewhere has already been removed before the first interview happens.
If a specific role or market segment does not fit neatly into the ranges above, that is usually a sign the benchmark needs adjusting to the context, not that the hiring process is broken. We are glad to work through role-specific benchmarking with any recruiting team weighing that call.
— Eugene
How we help you turn these benchmarks into higher acceptance rates
Most of the acceptance-rate gap below industry benchmarks comes down to one thing: too much time between a strong final interview and a signed offer. We close that gap by handing hiring managers a curated shortlist within 7 days, built on a skill-first vetting process that filters for fit before a candidate ever reaches an interview, so the final round moves straight to a decision instead of restarting the search.
Our pricing model removes two more sources of delay and risk that typically drag down acceptance rates: a fixed fee per seniority level means no renegotiation mid-search, and no upfront payment removes the budget approval step that often stalls a search before it starts. A 3-month replacement guarantee also means a mis-hire does not force a full restart, which keeps time-to-offer fast on the next search too.
What this looks like in practice:
- Curated shortlists delivered within a week instead of weeks of open sourcing.
- Fixed-fee pricing per seniority level.
- A replacement guarantee that protects the hire without restarting the search.
- Access to pre-vetted software engineering, DevOps, data, and sales talent across Latin America, including key countries such as Argentina, Brazil, Mexico, Colombia, and Chile.
If faster shortlists and a tighter time-to-offer are the levers your team needs to move acceptance rates up, reach out through our contact page and we will walk through what a benchmark-beating process looks like for your specific roles. For hiring leaders comparing agency models more broadly, Careerscape’s technology recruiting page outlines how staffing firms structure direct-hire and contract search across multiple US markets.
FAQ
Is a 30 percent acceptance rate high?
No, a 30 percent acceptance rate is low by most benchmarks. Even early-career and campus hiring, which runs lower than experienced-hire tiers, averages closer to 49 percent according to NACE, and most experienced-hire programs target 60 percent or higher.
Can you give me some examples of recruiting metrics?
Common recruiting metrics include offer acceptance rate, time-to-offer, offer rate, renege rate, and candidate response time. Tracking these together, segmented by role and candidate source, gives a far more useful picture than watching any single metric alone.
Out of 100 applicants, how many are interviewed?
This varies widely by role, industry, and how the applicant pool was sourced, and no single ratio holds across all hiring programs. The more reliable benchmarks to track once candidates reach the final interview stage are offer rate and offer acceptance rate, both of which have clearer industry reference points.
What is the 70/30 rule in hiring?
There is no single, widely recognized “70/30 rule” in recruiting benchmarking; the phrase is used inconsistently across different hiring guides. If you have seen it applied to a specific metric such as source mix or interview-to-offer ratios, it is worth confirming the definition with whoever published it before using it as a target.