
A trading desk watches prices move by the second. An HR team watches salary expectations move by the quarter. Both can have clean dashboards and still make bad decisions if the source is stale, unlicensed, or mapped to the wrong category. Market data analytics is the practice of collecting, validating, and analyzing price, volume, pay, and reference data so decisions about trading, risk, hiring, or cost rest on evidence rather than guesswork. Treat quality, freshness, and legal usability as financial variables and you'll avoid most expensive errors.
What Market Data Analytics Is and Where It Came From
Say a CTO approves a senior engineer offer from a six month old survey while local pay has moved. The candidate declines, the role stays open, and the team blames sourcing. The root cause is weaker than it looks because nobody checked provenance, age, or seniority mapping before using the number.
Market data analytics means collecting, validating, and analyzing market data so a decision can be reproduced, defended, and priced correctly.
That discipline is old. After stock ticker technology was introduced in 1867, ticker companies sold access to equity market information, as documented in a Federal Reserve study of market data history. In the early 1970s, U.S. policymakers addressed trading fragmented across primary exchanges, regional exchanges, and off exchange markets. By 2004, U.S. consolidated equity market data sales generated approximately $400 million, equal to roughly 10 to 15% of the total revenue reported by the largest exchanges.
Before you start hiring
Check location, salary, and hiring fit
If you are moving from research to action, start with the market basics so your hiring plan is clearer.
For a consumer level view of price and volume analysis, a market analytics guide for individual investors shows the same inputs at portfolio scale. Executives need the enterprise version, paired with talent market intelligence for hiring decisions when the market in question is people.

Core Metrics and Quality Checks That Matter
Market Data Scorecard
An average hides the problem you pay for. A feed can show a comfortable mean while its p99 latency spikes often enough to make alerts, quotes, or pay signals stale at the moment someone acts. That's why you monitor the distribution, not a single summary number, and why every chart needs a threshold that triggers action.
Reference points from CME Group market data documentation describe sub 100 microsecond targets for co located trading environments and sub 5 millisecond targets over wide area networks, while exchange connectivity can provide nanosecond level latency. You don't need trading speed for hiring data, but you do need the same discipline about delay.
Delay has physical causes. Network distance adds time. Queuing builds where fast systems feed slower ones. Processing in switches, routers, firewalls, and client applications adds more. For salary intelligence, delay usually comes from batch surveys, manual imports, and slow taxonomy updates rather than cables.
Timestamp every source update, keep ingestion to availability time, and expose freshness by country, role, and seniority. Link that freshness check to operational measures such as time to fill metrics for hiring teams, because an old benchmark often shows up first as longer vacancies and rejected offers.
A metric without a maximum acceptable age, latency, or error rate is decoration. Set the threshold before anyone uses the figure.
Data Sources and Tools Compared by Use Case
Market Data Source Types and Where Each One Fits
Don't buy tools before you've classified the source. An exchange feed needs licence controls and latency monitoring. A self reported salary survey needs sample checks, outlier rules, and clear warnings about who responded. Both can feed a polished dashboard, but they don't deserve equal trust.
Build the stack by layer. Use a cloud warehouse such as BigQuery or Snowflake for storage and reproducible history. Add Kafka only when updates must stream continuously, use dbt for standardized transformations and tests, then publish through Tableau or Looker. For teams evaluating vendors, compare that stack against purpose built salary benchmarking tools and their data controls rather than comparing chart features.
Specialist labor markets need the same source discipline. Niche fields described in career paths in water data science show why generic "data scientist" data can miss domain skills, certifications, and employer types.
Match the tool to the decision window. A monthly compensation review doesn't need streaming infrastructure. A real time risk alert can't wait for a nightly spreadsheet. Spending on speed you won't use starves the controls you need, especially validation.
How to Build a Market Data Analytics Workflow
Start with a workflow you can audit, then add sophistication. This sequence works for a price feed, a demand signal, or a pay benchmark because each step forces a decision before analysis begins.
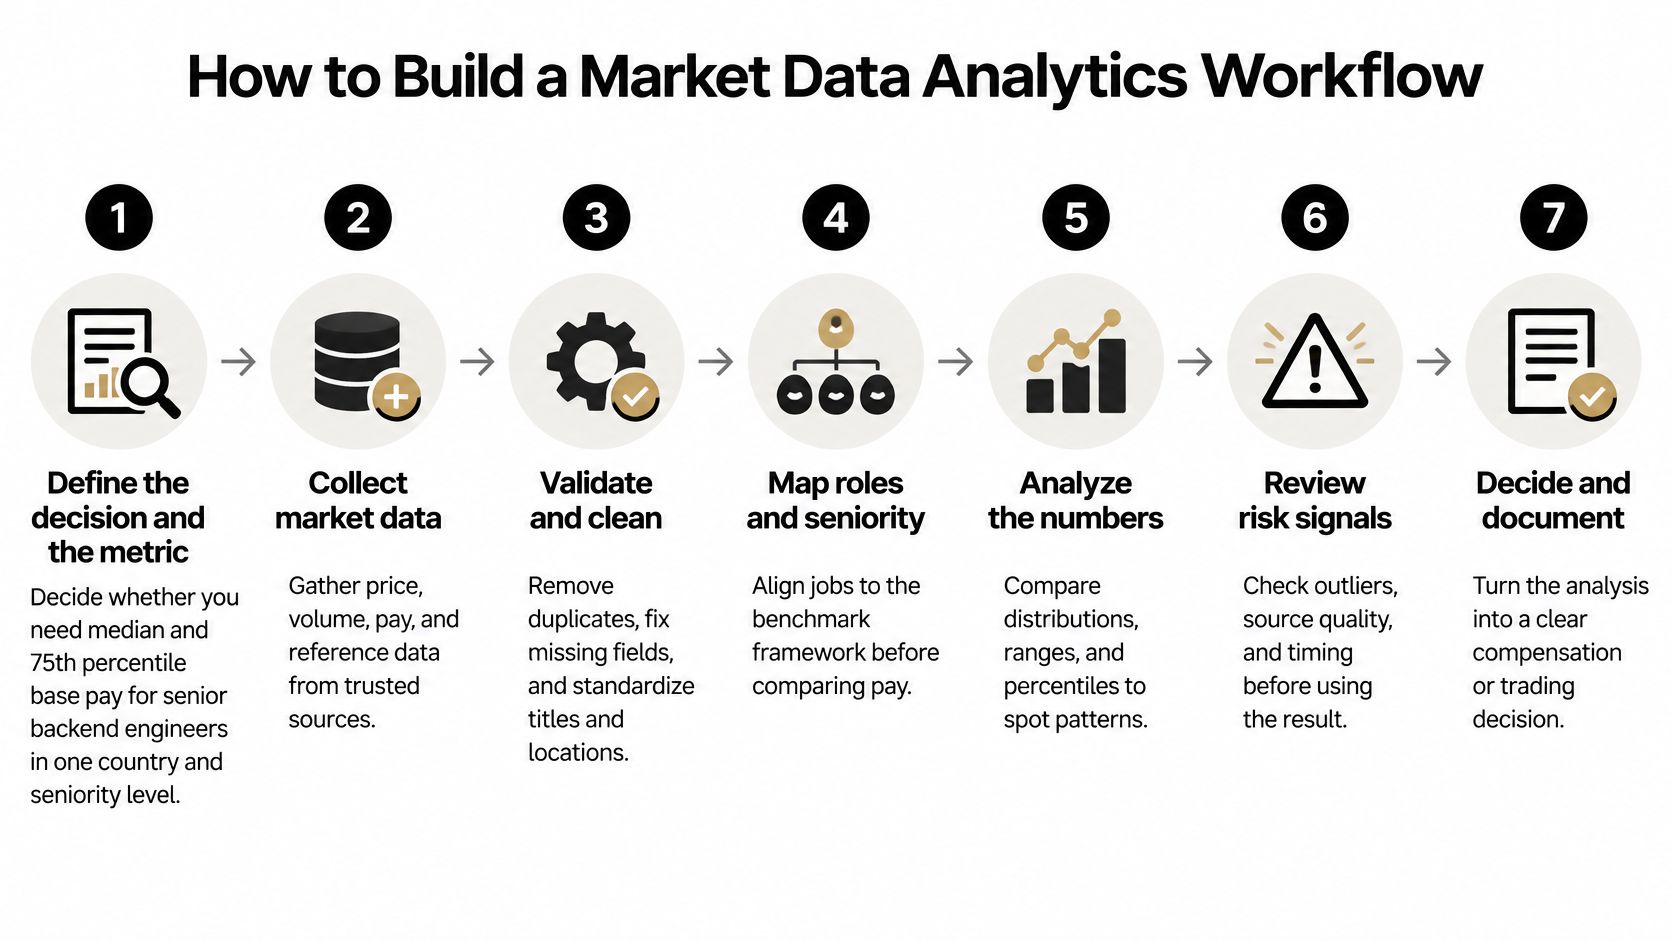
Seven Steps From Source to Decision
Define the decision and metric. Write the exact output, such as median and 75th percentile base pay for senior backend engineers in one country and seniority band. If you can't name the decision owner and action, you're not ready to collect data.
Inventory and score sources. Rate each dataset on provenance, legal usability, coverage, freshness, granularity, consistency, and decision value. A 2025 academic study in the Journal of Information Resources Management proposes four evaluation dimensions decomposed into 12 first level and 32 second level indicators, which supports a weighted score rather than one vague accuracy claim.
Ingest with timestamps and raw snapshots. Record when the source created the value and when your platform made it available. Keep the untouched file or payload so any published figure can be reproduced later.
Standardize identifiers. Align role taxonomy, seniority, country, currency, and pay period. Mixing gross with net pay, USD with local currency, or mid level with senior titles is the most common benchmark error, and a large dataset with inconsistent seniority mapping is still unusable.
Write data contracts. Agree schema, required fields, quality thresholds, and freshness service levels between producer and consumer. A dataset without legal use rights fails here, before analysts spend time on it.
Build the analysis layer. Publish p25, p50, and p75, trend rates over six and twelve months, sample size, and explicit outlier rules. Percentiles show the spread that a single average hides.
Publish with a quality label and review monthly. Mark each figure as a reliable benchmark or a directional estimate, show its age, and block pipelines that breach thresholds.</li>
The short walkthrough below shows how these steps connect in practice before you commit budget to tooling.
Don't let the dashboard hide weak inputs. If provenance is missing, coverage is thin, or freshness breaches the contract, the correct output isn't a prettier chart. It's a blocked pipeline and a clear explanation to the decision maker.
Using Market Data for Salary Benchmarking in LATAM
BLS Reference Values for Software Developers and Related Roles
Read the baseline narrowly. According to the U.S. Bureau of Labor Statistics occupational profile for software developers, software developers had median annual pay of $135,980 in May 2025, while the combined category of software developers, quality assurance analysts, and testers had median pay of $134,040. Compare developers with developers and QA with QA. A combined figure is useful context, but it's the wrong offer anchor for a specific job family.
Industry mix also changes the comparison. Computer systems design and related services employed 29% of software developers, followed by finance and insurance and software publishers, so a fintech scale up shouldn't benchmark only against generic technology employers. Match the employers most likely to compete for the same candidate.
For Latin America as a hiring solution, use the U.S. figure as a reference point, not as a discounted target. Build country and role specific percentile bands for Mexico, Brazil, Argentina, or your chosen market, then adjust for benefits, currency, pay period, and seniority. Follow a consistent method such as a step by step salary benchmarking process so finance and HR use the same definitions.
Set the offer at a defined percentile of the local band, based on scarcity and the cost of delay. If you need that band tied to live candidate pools, our IT recruitment service for LATAM roles connects benchmark work to active hiring.
Worked ROI Examples You Can Model Yourself
These examples are hypothetical. Replace every input with your own payroll, vacancy, and offer data before you present a result to finance.
Illustrative ROI Calculations for Market Data Decisions
The overpayment case is straightforward. Ten people paid $5,000 above the needed market level cost $50,000 every year, and that cost compounds through percentage based raises and benefits. A benchmark that prevents even part of that error can pay for validation work quickly.
A stale band creates the opposite loss. If your pay range is six months old in a hot role, candidates may decline before you learn the range is wrong. You then restart sourcing, lose product time, and often raise the offer anyway under pressure.
For vacancy delay, use base pay as a conservative proxy, then add recruiter fees, contractor cover, and lost output separately. Compare the result with regional data in LATAM hiring cost insights for finance planning, but don't import another company's assumptions without testing them.
Governance needs the same arithmetic. Reporting from Research and Markets on data analytics investment states more than 64% of data management leaders rank data quality and governance among their top five investment priorities for the next two to three years. Your business case should still be local, calculated as annual cost of bad data divided by annual cost of controls. Report that ratio, the incidents prevented, and the decisions improved.
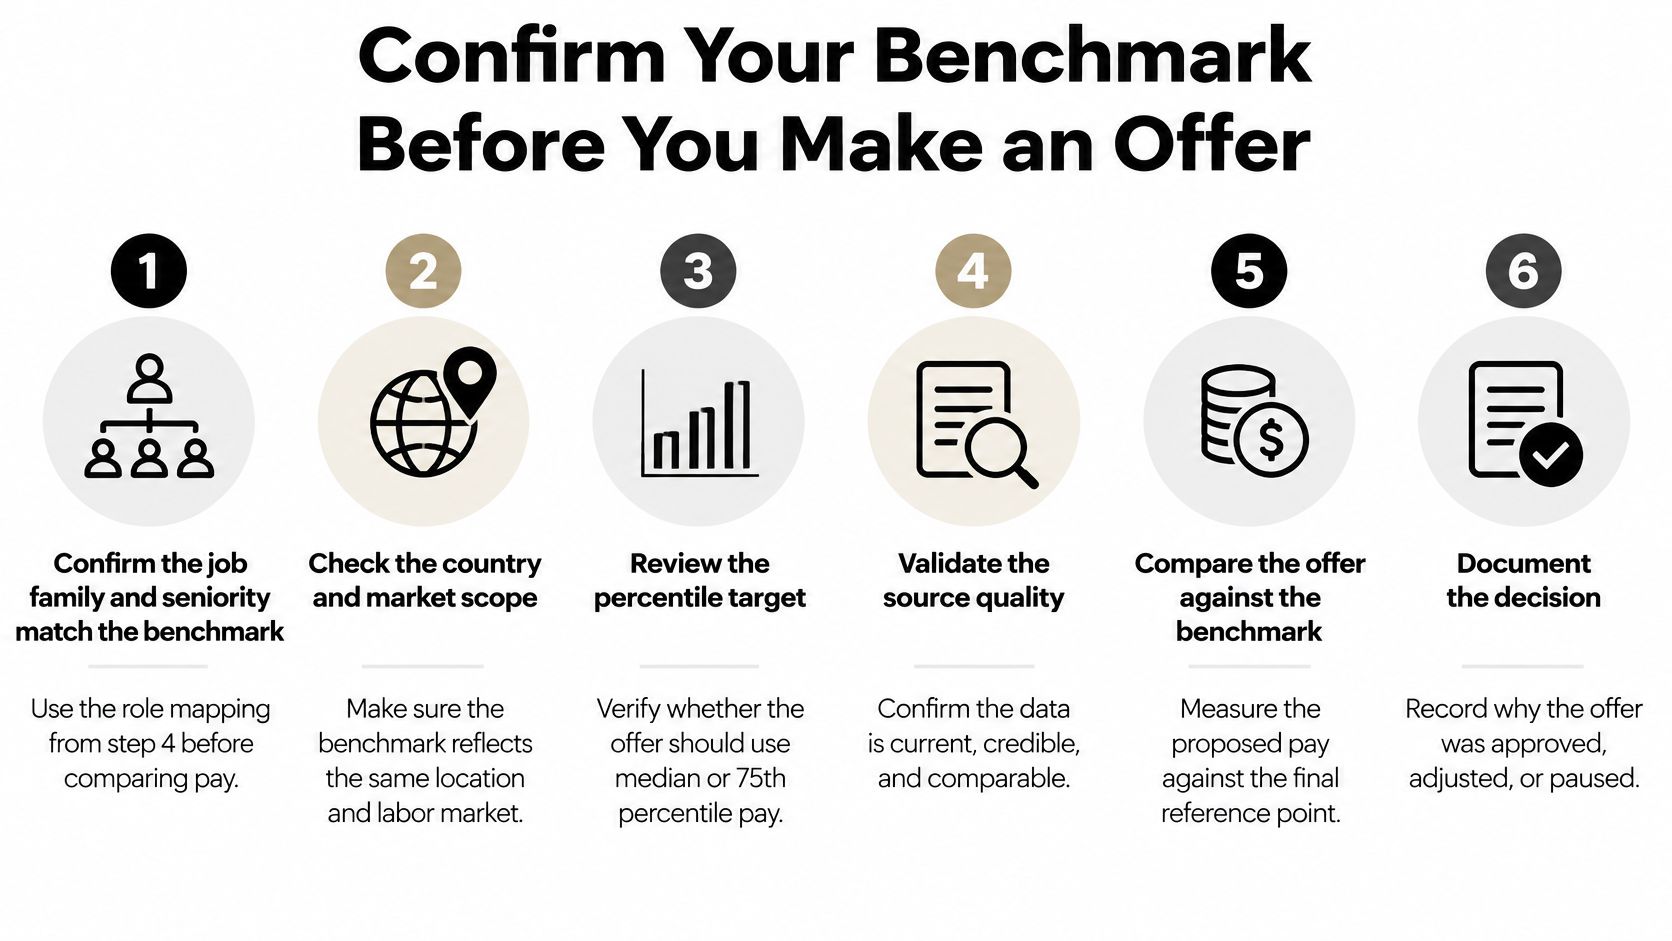
Confirm Your Benchmark Before You Make an Offer
Use this gate before any offer leaves the building.
Confirm job family and seniority match the benchmark mapping.
Check country, currency, and pay period, including gross versus net.
Confirm provenance and legal usability before using any figure.
Check freshness and reject bands older than your maximum age.
Assess the country across separate dimensions. The framework in the World Bank Latin America and Caribbean digital program uses six dimensions, namely digital infrastructure, digital platforms, digital financial services, digital businesses, digital skills, and the trust environment. Don't collapse them into one ranking.
Choose the hiring model, direct hire, employer of record, or RPO capacity for ongoing hiring, based on headcount and speed.
Set the offer at a defined percentile of the local band and document why.</li>
Assign ownership now. The CTO owns pipelines, data contracts, and freshness service levels. The HR Director owns job family mapping, offer percentiles, and the monthly review that blocks breached pipelines. Our salary benchmarking includes country and role specific salary data, percentile compensation bands, benefits and equity benchmarking, market trends and hiring insights, and a custom PDF report. The free LATAM Hiring Guide 2026 covers 2026 salary benchmarks, a hiring model comparison, compliance watch outs, and screening steps.
Request a country and role specific salary benchmark before your next offer, with percentile bands and the source quality checks your CTO and HR Director can both defend. Visit GENTY recruitment to discuss LATAM tech hiring, salary benchmarking, and the hiring model that fits your headcount plan.