

The interview to offer ratio is offers extended divided by unique candidates interviewed, shown as a percentage, and interviews per offer is its inverse. Interview 48 candidates and extend 6 offers and you're at 12.5%, or 8 interviews per offer.
The most repeated advice in recruiting content is to aim for 3:1, roughly 33%. Nobody published that number. Real figures for the same metric run from 7.3% for technical roles in Ashby's Q1 2026 recruiting operations data to 50% of professional candidates who completed an interview process in 2024, per CandE Pulse research published by ERE. That's a seven-fold spread between two credible sources describing the same event.
The spread isn't noise. It's a denominator problem, and until you know what each benchmark counts as an interview, none of them can tell you whether your funnel is healthy.
Interview-to-Offer Ratio Formula and Why Benchmarks Disagree
Write the formula once and keep it fixed: offers extended divided by unique candidates interviewed, multiplied by 100 for the percentage. Flip it, candidates divided by offers, and you get interviews per offer, the version engineering leaders quote in planning meetings because it maps directly onto panel hours.
Need help hiring?
See the next step after this guide
If this topic is relevant to your team, these are the most useful pages to check next.
The numerator is offers extended, never offers accepted. Accepting an offer is a different decision made by a different person for different reasons, and folding it in means a compensation problem looks like a sourcing problem.
What the ratio measures that applicant volume does not
Keep this metric away from your applicant-to-interview rate. That one measures how much of the top of the funnel survives screening, so it responds to job board spend, employer brand and job description quality. The interview to offer ratio measures the yield of the stage where senior people spend their calendar.
For a Series B platform team, the two move in opposite directions for good reasons. Tightening pre-screening raises the interview to offer rate and lowers the applicant-to-interview rate at the same time, because fewer, better-matched people reach a panel.
The benchmarks and what each one counts
The SHRM figures come from the Society for Human Resource Management's historical benchmark, which recorded 20% of interviews leading to offers in 2016, up from 17% in 2015, or roughly 5 interviews per offer against nearly 6 the year before, as summarised in its analysis of recruitment conversion rates.
The SmartRecruiters benchmark covered 89 million applications, 1.5 million jobs and 95 countries between September 2023 and August 2024, reporting about 33% globally and a US figure of 4.3% of applicants interviewed against 1.5% receiving offers, which works out to roughly 35%, per this review of interview-to-offer benchmarks.
The outliers are where the definition shows. Appcast's 2025 figure of 40.45% and Employ's 31.5% describe different employer populations and shouldn't be averaged into one target, as this breakdown of recruiting funnel conversion rates points out. Ashby's numbers sit far lower because every interviewed application is in the denominator, recruiter screens included.
Why a technical funnel reads differently
The technical gap is the one that matters for this audience. Ashby's data shows approximately 13.7 interviewed candidates per offer for technical roles against 9.6 for business roles, and the reason is stage design as much as skill scarcity. A team that counts every introductory call will always look worse than a team that counts only finalists, even when both run identical panels.
The comparison rule: a benchmark is only comparable when its denominator matches yours. Count every early call and your rate falls. Count finalists only and it rises. Same funnel, same quarter, two different stories.
Neither approach is wrong. They measure different events, and a board deck that mixes them with an external number produces a conclusion nobody can defend.
Four questions before you borrow any number
Population: are these offers to external candidates, internal moves, or both?
Stage: does an interview mean a recruiter screen or a hiring manager conversation?
Duplicates: does one person interviewed for two requisitions count once or twice?
Period: is this a trailing 12 months, a quarter, or roles still in flight?</li>
Answer those four and most apparent anomalies disappear. Your funnel probably isn't broken; it's being read against a benchmark that counted something else.
Run the same rigour on the other side of the decision. Our guide to offer acceptance rate benchmarks covers the stage after the offer, where a separate set of definitions decides whether that number means anything either.
How to Calculate the Ratio Without Mixing Definitions
A ratio you can't reproduce next quarter is an anecdote. Run this sequence once, document it, and every later quarter becomes a trend instead of a debate.
Fix the period and the role family. Use a quarter or a trailing 12 months, and calculate engineering, DevOps and sales separately. A blended company average averages away the only information a hiring manager can act on.
Count unique candidates with at least one interview. Then decide, in writing, whether someone who interviewed for two requisitions counts once per requisition or once overall. Duplicates inflate the numerator and make a healthy funnel look slow.
Declare whether recruiter screens count. Label the metric screen-inclusive or late-stage only. This single choice moves the rate further than any process change you'll make this year, so it belongs in the label, not in someone's memory.
Count offers extended, not accepted. A declined offer still tells you the interview stage produced a hireable decision. Acceptance is a separate metric with a separate owner.
Divide, then invert. Offers divided by unique interviewed candidates gives the percentage. Unique interviewed candidates divided by offers gives interviews per offer. Report both, because operations teams plan in hours and executives read percentages.
Exclude withdrawn requisitions and internal transfers, or report them on a separate line. Internal moves convert at a rate that has nothing to do with the external market you're trying to measure.
Save the definition next to the number. Six months from now, a new analyst will rebuild the metric from scratch unless the rule is written where the chart lives.</li>
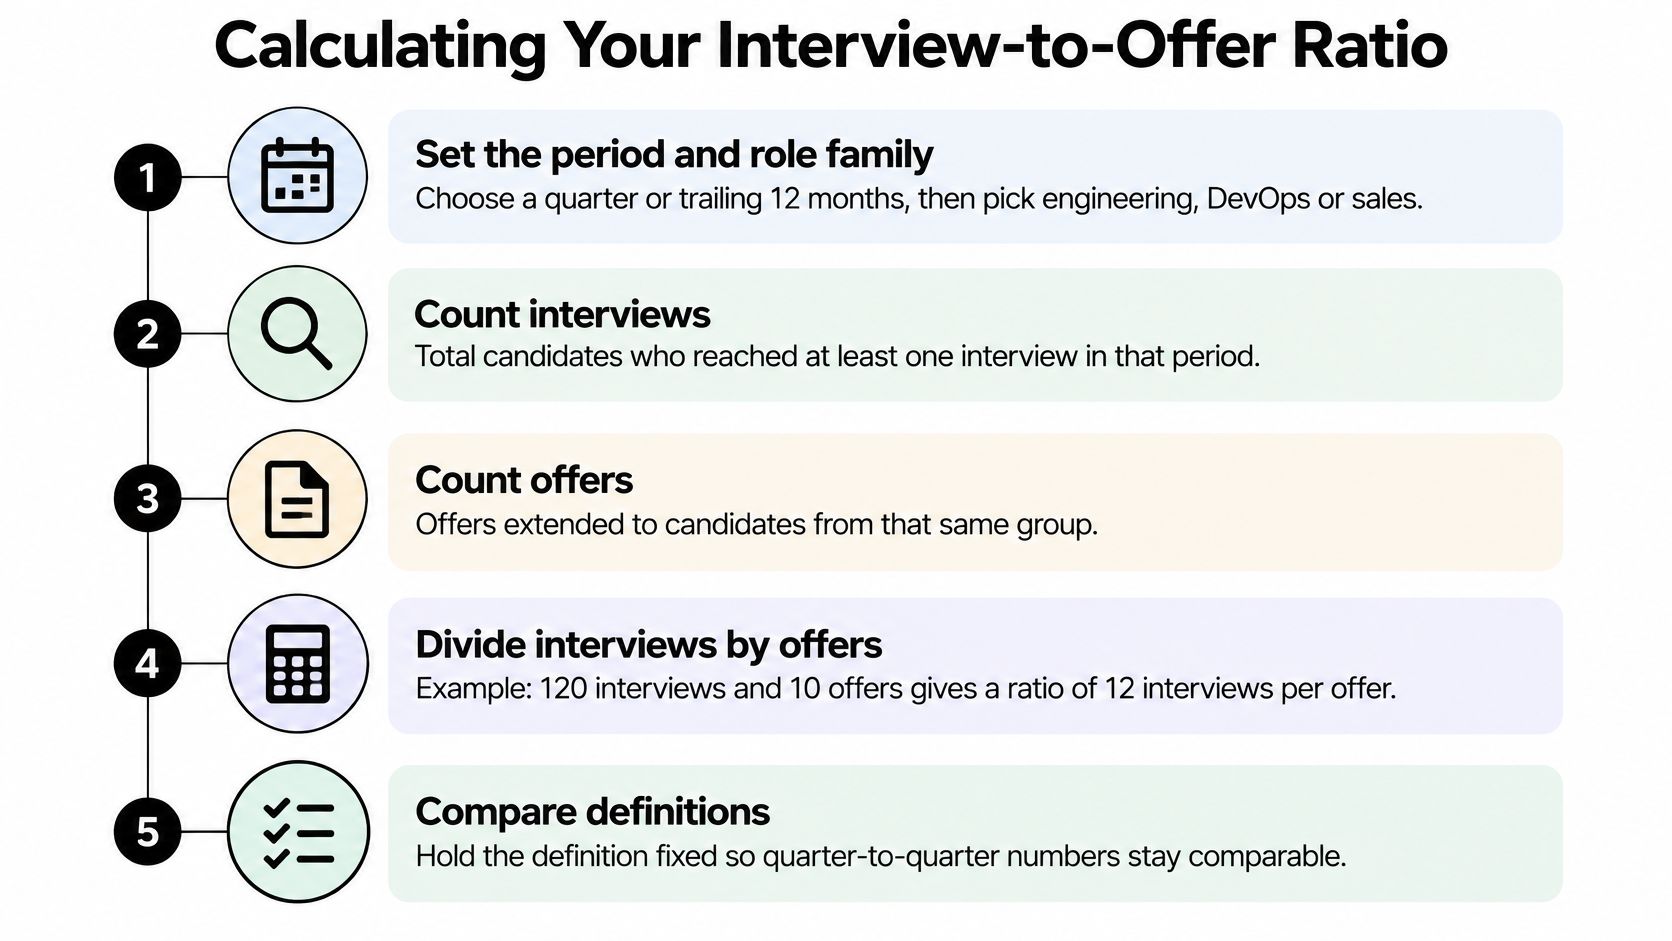
Work it through with real counts. Say a scale-up interviewed 84 unique candidates across engineering and DevOps in a quarter and extended 7 offers. That's 8.3%, or 12 interviews per offer, which reads as poor conversion until you check the label. If step three said screen-inclusive, the number is normal for a funnel that counts every first call, and the diagnosis should start with the screen, not the panel.
If step three said late-stage only, the same figure points at something else entirely, usually a technical bar that isn't documented well enough for interviewers to apply it consistently. Our guide to interview process best practices for remote LATAM hiring covers how to tighten that stage without adding rounds.
Which Candidate Sources Drive Your Ratio
A company-wide ratio blends populations that behave nothing alike. Referrals and sourced candidates pass through the same panels and produce wildly different offer rates, so the average describes no candidate you'll interview.
Ashby data summarised in this report on recruiting funnel conversion by stage found that, among interviewed candidates, sourced and inbound candidates each converted to offers at about 6%, referrals at 16% and internal candidates at 32%. Take the reciprocal and the operational cost becomes visible: roughly 17 interviews for one offer from sourced or inbound flow, against about 6 for referrals and 3 for internal moves.
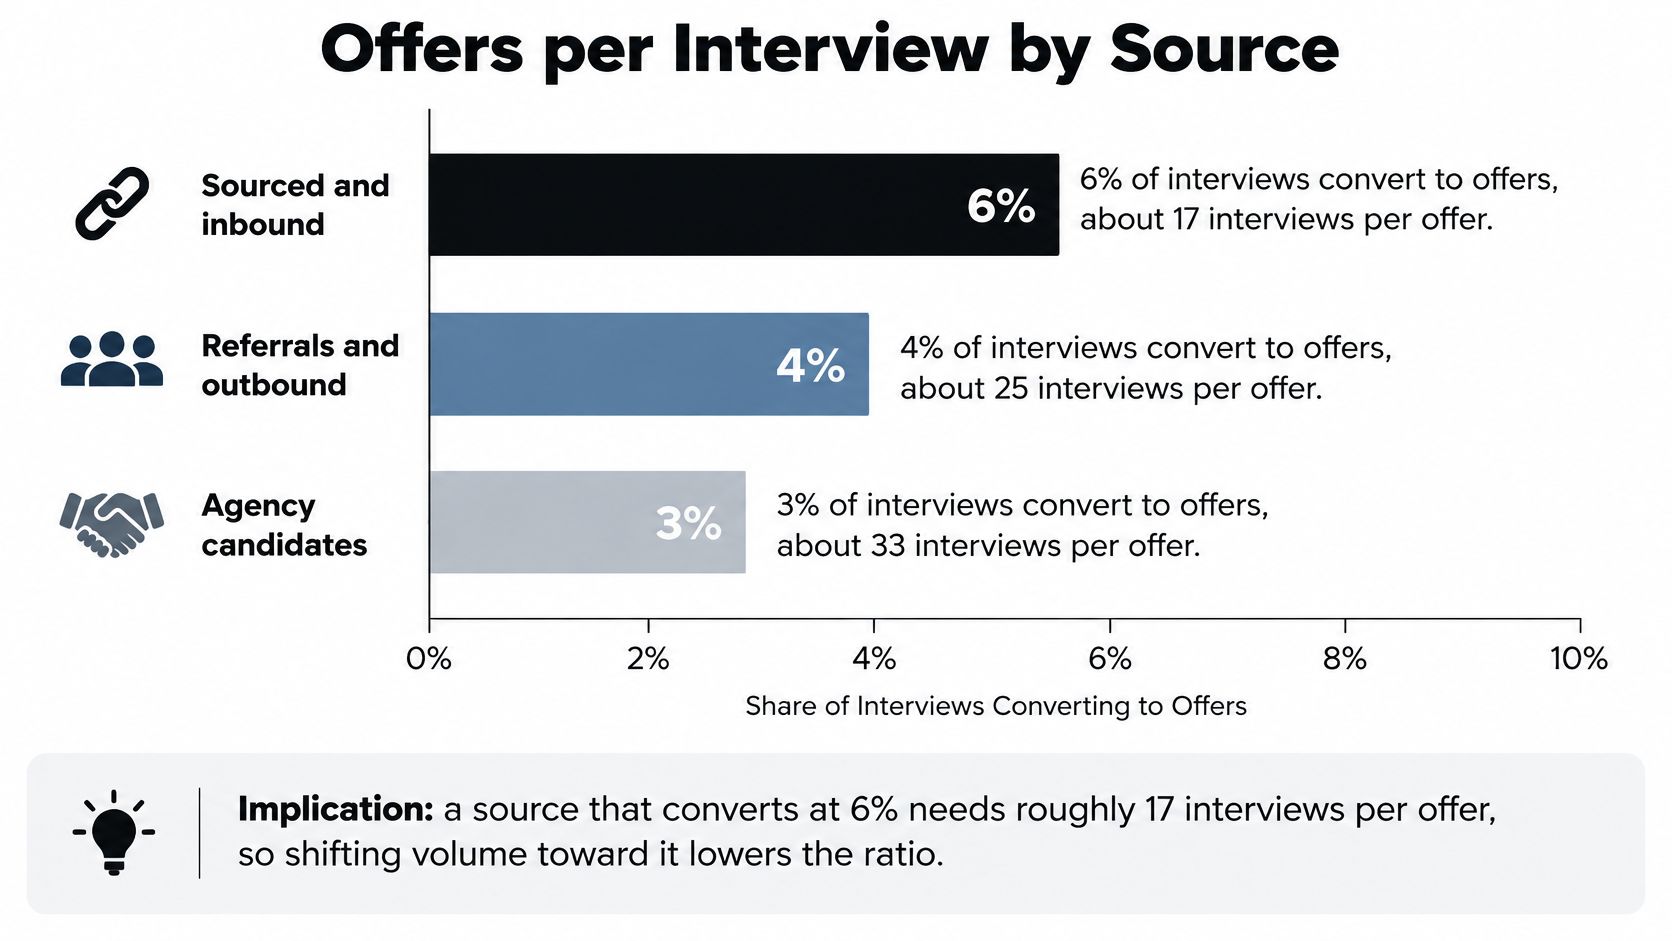
The diagnostic follows directly. Report conversion by source for two quarters and you'll see which channel is consuming panel hours without producing decisions. If referrals convert better because employees explain the role candidly before the first call, the fix is better referral briefings and a sharper pre-interview calibration, not more interview slots.
That reframing matters when sourcing sits partly outside your team. Scale-ups comparing in-house capacity against remote staffing agencies should ask what the partner's screening stage filters, because a partner that passes volume into your panel will raise your ratio without improving your hiring.
Apply the same split to geography, recruiter, seniority and technical specialty. Our guide to candidate sourcing covers how to instrument those cuts. One caution: internal candidates arrive in small volumes, so their 32% conversion is a signal about internal mobility, not a target you can set for external hiring.
Reading a Low or High Ratio in Technical and Sales Hiring
The number alone diagnoses nothing. What surrounds it does, and the same figure means opposite things depending on interview volume, stage and offer acceptance.
Start with the row that matches your data, then run the check before touching the sourcing budget. A rising interview volume with a falling rate usually means the screen is letting through candidates who never had a chance, and adding more interviews makes it worse.
The effort side is where the diagnosis gets uncomfortable. Gem's benchmarking reports interviews per hire up 33% overall, with technical roles averaging 35 to 36 interviews and 26 interviewer hours, while offer acceptance sat near 82%, according to this collection of recruiting benchmarks. A funnel can look healthy at the offer stage and still be losing candidates to a process that takes too long.
A high ratio can mean a sharp shortlist or a panel that only ever met the favourite. The metric can't tell those apart. Acceptance and early performance can.
Speed compounds the problem. Interview velocity and compensation alignment decide how fast a role closes, which is why both belong in the diagnosis before anyone argues about sourcing volume.
For nearshore hiring, segment before you compare. Role scarcity, compensation expectations, language requirements and time zone preferences across Latin America move both candidate availability and conversion, so a Mexico City DevOps search and a US-wide benchmark answer different questions.
Raising the Ratio Without Lowering Hiring Quality
Interview structure is the lever with evidence behind it. A meta-analysis of 31 studies found an average interview validity coefficient of 0.27 and an estimated true validity of 0.38, and interview structure was the only examined characteristic that moderated validity, according to this review of interview validity research. A separate meta-analytic review covering 245 validity coefficients and 86,311 individuals found structured interviews outperformed unstructured ones, with situational formats ahead of job-related and psychologically based ones.

Four changes convert that evidence into a working panel. They're small, and each one raises the ratio by removing candidates who were never going to clear the bar, not by lowering it.
A scorecard with behaviourally anchored ratings. Write what strong evidence looks like for each competency before the role opens, so two interviewers scoring the same answer land in the same place.
Identical core questions for every candidate in the role family. Comparability is what makes a shortlist defensible when a hiring manager asks why one candidate advanced.
Predefined knockout criteria agreed at intake, covering essential requirements such as language level, availability overlap and depth in the primary stack.
A calibrated panel that scores before discussing. Independent scores first, conversation second. Group discussion before scoring pulls everyone toward the loudest voice.</li>
Track the funnel at each stage, not just the headline: recruiter screen to interview, interview to offer, offer acceptance, and 90-day performance. If the ratio improves after structured evaluation lands while acceptance and early performance hold steady, the improvement is qualification, not a looser standard.
Before any offer goes out, our recruiters check technical depth, English and availability, so the candidates who reach a client panel have already cleared the three screens that most often fail late. That pre-work is also where nearshore pools get segmented by country, time zone and English level, so a ratio is compared within the market that produced it.
If the constraint is candidate quality rather than process, the wider tactics in these strategies for winning over skilled hires address the demand side. For the scoring mechanics, our template for a technical interview scorecard gives you the structure to reuse across roles.
Set a Baseline and Review the Ratio Each Quarter
Decide this quarter, not next. Reuse the definition you wrote during the calculation steps, including denominator, stage and period, and store it beside the number so nobody rebuilds it later.
Pull two to three past quarters for each role family before changing anything. A baseline from your own funnel is the only comparison that accounts for your stage definitions, your seniority mix and your sourcing channels, and it costs nothing to assemble.
Then set a target band per role family, not one company number. Engineering, DevOps and sales each get a range built from their own history, with the benchmark table used as context rather than as a goal. A technical funnel landing at 10% isn't failing if it counts every early call and has always landed there.
Review quarterly alongside acceptance, time-to-fill and 90-day retention, and change one lever at a time. Changing scorecard use, referral briefings and sourcing channels in the same quarter tells you that something moved but not what. Our time-to-fill metrics guide covers how those companion measures interact with conversion rates.
One lever per quarter. If three variables change and the ratio improves, you've learned nothing you can repeat.
If internal capacity is the constraint rather than process design, compare running this in-house against a managed model. Our RPO service at recruitment process outsourcing covers the full funnel with a dedicated recruiter reporting at each stage, and IT recruitment covers technical roles end to end.
For a wider set of funnel KPIs to sit alongside this one, this recruitment dashboard KPI guide lists the metrics that pair well with conversion rates. And if you'd rather start from your own baseline than a generic target, book a call with our team or send a message describing your hiring need, and we respond within 24 hours.
GENTY recruitment builds curated, interview-ready shortlists for tech and sales roles across Latin America, and reports at each funnel stage, from candidates sourced to offers extended, so your interview to offer ratio is calculated from real counts rather than an estimate. If you want a shortlist screened for technical depth, English and availability before anyone reaches your panel, we can show you what that does to your ratio for a specific role family. Visit GENTY recruitment to start the conversation.